
Reading a Miner Profitability Ranking Without Being Misled
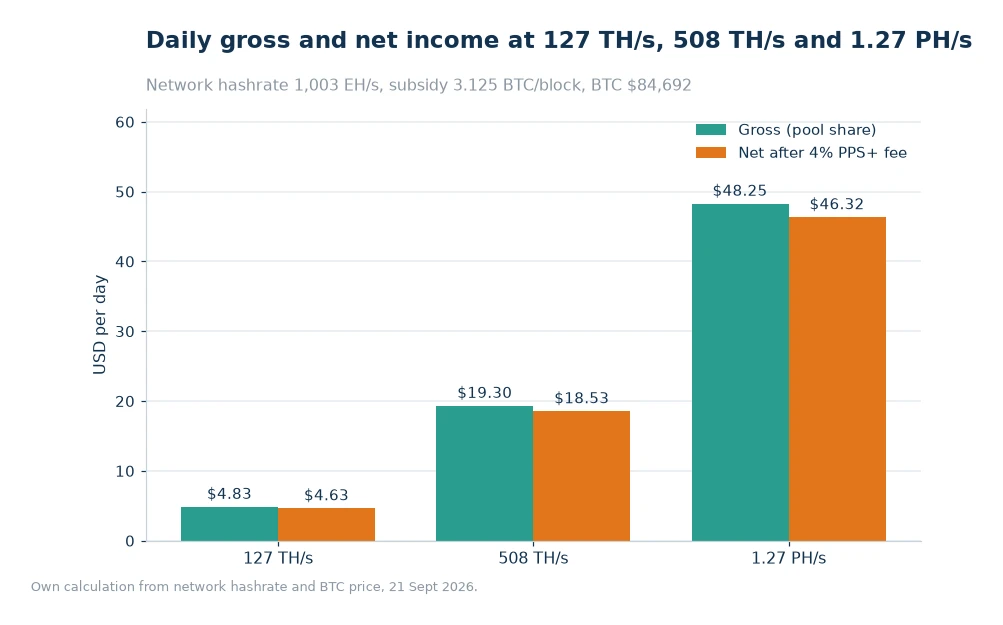
A profitability ranking is a spreadsheet of today's inputs, not a verdict on a machine. It multiplies a hashrate by a coin price and divides by a difficulty, then subtracts a power estimate that may not match your tariff. At 127 TH/s the pool side of the ledger reads $4.83 gross and $4.63 after the listed 4%; whether that becomes a surplus or a loss depends almost entirely on the joules per terahash and the price of a kilowatt-hour.

Key takeaways
- At 127 TH/s, gross income is $4.83 a day and $4.63 after the listed 4% on the block-reward component.
- Efficiency matters more than headline hashrate: 20 J/TH leaves about $0.97 a day at this tier, while 30 J/TH turns negative.
- Rankings usually assume a power price near $0.06/kWh, so replace it with your own before trusting the order.
- A model's position in the table changes with the coin price and difficulty, sometimes within the same week.
A table built from three moving inputs
Every row in a ranking is produced from the same three numbers: the machine's hashrate, the network difficulty and the coin price. Two of those change daily and the third changes every couple of weeks. The ranking is therefore a photograph of a market, and the order in the photograph is only as durable as the market it captured. A model that sits comfortably in the top half today can drop several places after a difficulty rise without any change to the hardware.
That is not a criticism of the tool; it is what the tool is for. A ranking compresses a large comparison into a short list, and the compression is the value. The mistake is treating the compressed view as a permanent property of the machine rather than as a reading taken at a particular moment.
The number the ranking cannot see
Your electricity tariff is the largest input the ranking does not know. Most comparisons assume something close to $0.06/kWh because that is a common industrial figure, and a household paying $0.14 is looking at a completely different decision. Run the same machine through both prices and the ranking order can invert, which tells you the table was ranking a scenario rather than a product.
Cooling and infrastructure belong in the same correction. A machine in a cold climate vents heat that would otherwise be paid for; a machine in a hot one needs additional fans or air conditioning that never appears in a specification sheet. Neither is in the ranking, and both change the monthly total by more than a couple of percentage points.
Joules per terahash is the durable ratio
Hashrate depreciates against the network; efficiency does not. A 20 J/TH machine and a 30 J/TH machine with the same hashrate earn identical pool credits and face very different power bills, and the gap widens as difficulty rises because the power cost stays fixed while the income shrinks. Over a three-year horizon, that ratio does more to determine survival than a few terahashes of headline performance.
The practical test is simple. Take the machine's efficiency in joules per terahash, multiply by 24 hours and by your tariff, and compare the result with the daily credit per terahash. If the answer is negative at today's difficulty, the machine is relying on a future coin price to make sense. That is a legitimate position to take deliberately, and a poor one to take by accident.
What a ranking leaves out entirely
Noise, heat, physical size, firmware support and the willingness of a manufacturer to honour a warranty are all absent from a profitability column. So is resale value, which for a miner is often the difference between a bad purchase and a catastrophic one. A model that is 5% more profitable per day but has no second-hand market is not obviously the better buy.
Supply matters too. A ranking can list a model that is unavailable at any sensible price, or available only in a batch of fifty. Operators who already mine on ViaBTC Crypto Mining can compare a candidate against their own fleet rather than against a table. Check the listing against actual stock before falling in love with a row, and check the repair path: a board that cannot be replaced locally turns a small failure into a long outage.
Using the payback column properly
Payback periods are usually quoted as purchase price divided by daily net income, which assumes both remain constant. Neither does. A more honest version divides the price by a conservative daily figure and then adds a margin for the difficulty trend. If the result still looks acceptable, the purchase has room for error; if it only works at today's number, it has none.
The conservative figure is easy to construct: take the gross credit, subtract the listed pool fee, subtract power at your tariff, and then apply a haircut for the next year of difficulty growth. Two haircuts are worth testing: one for a flat network and one for a network that keeps adding capacity. The haircut is a judgement, not a fact, which is exactly why it belongs in your own spreadsheet rather than in a vendor's comparison table.
Two efficiency classes at one hashrate
The table holds hashrate at 127 TH/s and changes only the efficiency, then prices power at $0.06/kWh. The point is how quickly a difference of ten joules per terahash becomes a difference in whether the machine pays for itself.
| Line | 20 J/TH | 30 J/TH |
|---|---|---|
| Power draw | 2,540 W | 3,810 W |
| Energy per day | 60.96 kWh | 91.44 kWh |
| Power cost per day | $3.66 | $5.49 |
| Left after power | $0.97 | −$0.86 |
Worked example
Run the 127 TH/s tier through both efficiency assumptions.
- The daily output of one terahash is 450 divided by 1,003,000,000, or 0.00000044865 BTC.
- 127 TH/s: 127 × 0.00000044865 = 0.0000569786 BTC a day.
- Gross dollars: 0.0000569786 × 84,692 = $4.8249, rounded to $4.83.
- After the listed 4%: 4.8249 × 0.96 = $4.6319, rounded to $4.63.
- At 20 J/TH: 127 × 20 = 2,540 W; 2.54 kW × 24 = 60.96 kWh; × $0.06 = $3.6576.
- Remainder: 4.6319 − 3.6576 = $0.9743, rounded to $0.97.
- At 30 J/TH: 127 × 30 = 3,810 W; 91.44 kWh × $0.06 = $5.4864; remainder −$0.8545.
- Scaling to 1.27 PH/s multiplies every line by ten, including the negative one.
Frequently asked questions
How accurate is a miner profitability ranking?
It is accurate for the inputs it uses on the day it runs, which are usually the current difficulty, the coin price and an assumed power rate near $0.06/kWh. Substituting your own tariff changes the order more often than people expect.
Does a higher hashrate always mean more profit?
No. Two machines with the same hashrate can differ by ten joules per terahash, which at 127 TH/s is the difference between $0.97 a day and a loss of $0.86 before any other costs.
What should I check before buying a model near the top of the list?
That it is actually in stock at the listed price, that spare boards and fans are available locally, and that your own power cost leaves a margin at today's difficulty rather than at a hoped-for price.
Rank the meter, then the machine
Sort the shortlist by efficiency first, then by hashrate, then by price, and check the survivors against the Miner Profitability Ranking with your own tariff in hand. The list is a starting filter, not an answer, and it is most useful when it disagrees with your instinct about a particular model. Before buying, confirm the daily expectation in the Profit Calculator and ask what the same machine would earn if difficulty rose 10%.
Chain inputs on 21 Sept 2026: network hashrate 1,003 EH/s, difficulty 132.76 T, 3.125 BTC per block, coin price $84,692[1]. Published 24 Oct 2026. Efficiency and tariff values are assumptions used to show the comparison, not specifications of any model.